Low Symbol Rates (SR) in the practice of satellite reception
Niedrige Symbolraten (SR) in der Praxis des Satellitenempfangs
Nízke Symbolové rýchlosti (SR) v praxi satelitného príjmu

Low Symbol Rates (SR) in practice of satellite reception
Eutelsat 21B at 21.5°E-Western : PF Prodelin 450 & PF Prodelin 370
11 603,800 MHz_H_SR=185 ksym/s : LUXE Radio
Note : In this scientific and research center,the functionality of a technological process and invention called Synchronous Nanocorrections, authored by Roman Dávid from Lučenec,is systematically proven, and it is also the only place where you can encounter the benefits of this technology.
In diesem wissenschaftlichen und Forschungszentrum wird systematisch die Funktionalität des technologischen Verfahrens und der Erfindung mit dem Namen "Synchrone Nanokorrekturen" vom Autor Roman Dávid aus Lučenec nachgewiesen. Es ist gleichzeitig der einzige Ort, an dem Sie dieser Technologie persönlich begegnen können.
Upozornenie : V tomto vedecko-výskumnom centre sa systematicky dokazuje funkcia technologického postupu a vynálezu s názvom "Synchrónne nanokorekcie", od jej autora Romana Dávida z Lučenca a je to zároveň jediné miesto kde sa s výhodami tejto technológie môžete stretnúť
( Update date: 11.9.2024 )
>Eutelsat 21B at 21.5°E_Low Symbol Rate>SR=185 ksym/s in satellite reception practice & LUXE Radio <
EN: EUT 21B_11 603,800 MHz-LUXE Radio : Today, I can demonstrate 100% reception stability on each of the three applied oscillators over a total monitoring period of t=136 hours, with a quality peak SNR=15.5 dB on the carrier C/f=11,603.790 MHz - LUXE Radio, with an SR value of 185 ksym/s.
DE_EUT 21B_11 603,800 MHz-LUXE Radio : Heute kann ich die Empfangsstabilität zu 100% auf jedem der drei angewendeten Oszillatoren in der gesamten Überwachungseinheit von t=136 Stunden nachweisen, bei einem Qualitätsspitzenwert von SNR=15,5 dB auf dem Träger C/f=11.603,790 MHz - LUXE Radio, mit einem SR-Wert von 185 ksym/s.
SK: EUT 21B_11 603,800 MHz-LUXE Radio : Dnes dokážem stabilitu príjmu na 100% na každom z troch aplikovaných oscilátorov,v celkovej kvantite jednotky monitoringu t=136 hodín,pri špičke kvality SNR=15,5 dB na nosnej C/f=11 603,790 MHz-LUXE Rádio s hodnotou SR=185 ksym/s
►►Eutelsat 21B at 21.5°E-Western : Low symbol rates (SR) in satellite reception practice
During the continuous signal monitoring of signal distribution, a symmetric reflector Prodelin with diameters of 450 and 370 cm was applied
Beim kontinuierlichen Signalmonitoring der Signalverteilung wurde ein symmetrischer Reflektor von Prodelin mit Durchmessern von 450 und 370 cm verwendet
Pri výkone kontinuálneho signálneho monitoringu signálnej distribúcie bol aplikovaný symetrický reflektor Prodelin s priemerom 450 a 370 cm
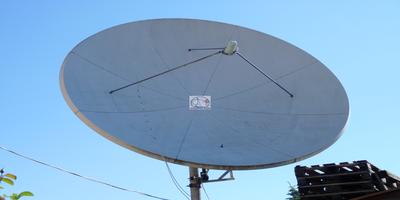
Installed symmetric reflectors and the diameter of their effective area : D=370 & 450 cm
Installierte symmetrische Reflektoren und der Durchmesser ihrer effektiven Fläche : D=370 & 450 cm
Inštalované symetrické reflektory a priemer ich efektívnej plochy : D=370 & 450 cm
R1
R2
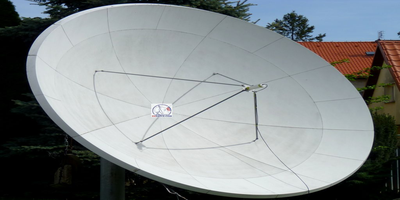
►Signálny reťazec je tvorený / The signal chain consists of the following components : Prodelin 450/370 cm
Signálny reťazec je tvorený :
PF Prodelin 450 cm > Primárny žiarič > Romanom Dávidom navrnuté systémové riešenie z roku 2008 tvorené len jedným kusom zlievarenského odliatku (nie z CNC alebo sústruhu),s fyzikálnymi úpravami,ktoré minimalizujú akékoľvek odrazy vlnenia,maximalizujú jeho signálnu priepustnosť,pri vysokej vodivosti tubusu,s konkrétnym zameraním na prevedenie vlnovodnej príruby > LNB SMW_PLL 9.75 F s LOF stabilitou +/- 10 kHz
PF Prodelin 370 cm > Primárny žiarič umiestnený v mechanizme manuálnej SKEW rotácie > polarizačná výhybka OMT typ ESA-1212-X/1> LNB SMW_Q-PLL type R, LOF stabilita +/- 25 kHz
PF Prodelin 450_The system solution proposed by Roman Dávid, comprised of a single cast piece from a foundry (not CNC or lathe), with physical modifications that minimize any wave reflections,maximize its signal permeability,with high conductivity of the tube, and a specific focus on implementing the waveguide flange > SMW PLL LNB 9.75 GHz +/- 10 kHz
PF Prodelin 370 cm > Primary feedhorn placed in the manual SKEW rotation mechanism > OMT type ESA-1212-X/1 > LNB SMW Q-PLL type R, LOF stability +/- 25 kHz
PF Prodelin 450_Der von Roman Dávid vorgeschlagene Systemansatz, bestehend aus einem einzigen gegossenen Stück aus einer Gießerei (nicht CNC oder Drehbank), mit physikalischen Modifikationen, die jegliche Wellenreflexionen minimieren, die Signalpermeabilität maximieren, mit hoher Leitfähigkeit des Rohrs
und einem speziellen Fokus auf die Implementierung der Wellenleiterflansche > SMW PLL LNB 9.75 GHz _ +/- 10 kHz
PF Prodelin 370 cm > Primärstrahler im manuellen SKEW-Rotationsmechanismus platziert > OMT Typ ESA-1212-X/1 > LNB SMW Q-PLL Typ R, LOF-Stabilität +/- 25 kHz
►►Eutelsat 21B at 21.5°E-Western : Beacon frequency / TT&C
Eutelsat 21B : BEACON FREQUENCY > f=12 500.5 MHz_V
- šírka rozmietania SP=100 kHz -
- hodnota vstupných filtrov RBW= 1 W/kHz + 600 W/Hz -
► týmto som dokázal že mnou navrhnutý signálny reťazec generuje frekvenčné údaje s vysokou presnosťou (na jednotky tisícin-1/1000 z jednotky 1 MHz)
čiže publikované údaje sú hodnoverné a relevantné pre vedecko-výskumnú prácu v oblasti vlnovej fyziky
►I have demonstrated through this that the signal chain I have designed generates frequency data with high precision
(to the order of one-thousandth, 1/1000, of 1 MHz). Therefore, the published data is reliable and relevant.
►►Eutelsat 21B at 21.5°E-Western-spectrum analysis : 11 603,800 MHz_H - LUXE Radio
C1_11 599,250 MHz : Chada FM
C2_11 599,530 MHz : Medina FM
C3_11 599,760 MHz : MED Radio
C4_11 602,760 MHz : Atlantic Radio
C5_11 603,790 MHz : LUXE radio
C5_Carrier width/Trägerbreite : 249 kHz
SPAN=1 MHz : 11 599,250>11 599,530>11 599,760 MHz >11 602,760 > 11603,790 MHz

►►Eutelsat 21B-LUXE Radio : Selection of the oscillator in relation to the resulting quality and continuity of the Lock process
►Qualitätsindikators "Q" von 100% auf einen Wert von Q=80% visualisiert, bei einer erreichten Qualitätsspitze von SNR=12,4 dB mit LOF=9,75 GHz.
►Zhrnuté a podčiarknuté : priebeh príjmu s oscilátorom s LOF=9.75 GHz v štvoroscilátorovom LNB značky SMW typ Q-PLL-R je výrazne náchylnejší na možné výpadky v kontinuite Locku ako keď som v signálnom reťazci spracovania vlnenia aplikoval oscilátor s LOF=10 GHz.Rozdiel v špičke kvality v jednotke SNR dosahoval len okolo 0,6-0,8 dB,ale tento rozdiel v dosiahnutej kvalite a chybovosti nemožno nejakým spôsobom zovšeobecňovať na každú nosnú vo frekvenčnom spektre,pretože v závislosti od výberu tej-ktorej nosnej v danej časti frekvenčného spektra môže byť výsledok aj úplne opačný v porovnaní oscilátorov s LOF=10 GHz/9.75 GHz.Sú nosné kde pri porovnaní kvality príjmu žiadny rozdiel nezaznamenáte a sú nosné kde rozdiel v kvalite môže byť aj väčší ako 2-3 dB,inak povedané všetko závisí od konkrétneho prípadu a nikto Vám nemôže vopred garantovať bez testu na konkrétnom prípade,že ak si zakúpite tento LNB,potom s daným LOF Vám kvalita "zaručene" stúpne o 1 alebo 2 dB, pretože by to bolo zavádzanie,alebo neobjektívne hondotenie,ktoré by mohlo vzbudiť očakávania,ktoré by sa v praxi nemuseli naplniť a veľmi často sa aj nenaplnia. Píšem to preto aby si niekto nemyslel že sa mu len tak a bez hlbokých vedomostí podarí dosiahnúť výrazný rast kvality príjmu len triviálnou/laickou výmenou LNB, inými slovami bezpracne/náhodne,alebo ako hovorila moja babka "Ako Slepé kura k zrnu prišlo" .
In summary: The reception performance with the LOF=9.75 GHz oscillator in the SMW Q-PLL-R four-oscillator LNB is significantly more susceptible to potential disruptions in Lock continuity compared to when I used an oscillator with LOF=10 GHz in the signal processing chain. The difference in peak quality in terms of SNR was only about 0.6-0.8 dB, but this difference in achieved quality and error rate cannot be generalized across all carriers within the frequency spectrum. Depending on the selection of the specific carrier in a given part of the frequency spectrum, the result may even be completely opposite when comparing oscillators with LOF=10 GHz and 9.75 GHz. There are carriers where no difference in reception quality is observed, and there are carriers where the difference in quality can be greater than 2-3 dB. In other words, everything depends on the specific case, and no one can guarantee in advance, without testing a specific case, that if you purchase this LNB, the quality with the given LOF will "definitely" increase by 1 or 2 dB. Such claims would be an incorrect assessment that could raise expectations that might not be fulfilled in practice—and often aren't. I emphasize this so that no one assumes they can achieve a significant improvement in reception quality with a trivial or layman replacement of the LNB, in other words, without effort, randomly, or as the saying goes, "A blind chicken finds a grain."
Zusammengefasst: Die Empfangsleistung mit dem LOF=9,75 GHz-Oszillator im vierfachen SMW Q-PLL-R LNB ist deutlich anfälliger für mögliche Unterbrechungen in der Kontinuität des Lock im Vergleich zur Verwendung eines Oszillators mit LOF=10 GHz in der Signalverarbeitungskette. Der Unterschied in der Spitzenqualität in Bezug auf das SNR betrug nur etwa 0,6-0,8 dB, aber dieser Unterschied in der erreichten Qualität und Fehlerrate kann nicht auf jeden Träger im Frequenzspektrum verallgemeinert werden. Je nach Auswahl des spezifischen Trägers in einem bestimmten Teil des Frequenzspektrums kann das Ergebnis sogar völlig entgegengesetzt sein, wenn man Oszillatoren mit LOF=10 GHz und 9,75 GHz vergleicht. Es gibt Träger, bei denen kein Unterschied in der Empfangsqualität festgestellt wird, und es gibt Träger, bei denen der Unterschied in der Qualität größer als 2-3 dB sein kann. Mit anderen Worten, alles hängt vom konkreten Fall ab, und niemand kann im Voraus, ohne einen Test des konkreten Falls, garantieren, dass die Qualität mit dem gegebenen LOF um 1 oder 2 dB "definitiv" steigt, wenn Sie dieses LNB kaufen. Solche Behauptungen wären eine fehlerhafte Beurteilung, die Erwartungen wecken könnte, die in der Praxis möglicherweise nicht erfüllt werden—und häufig auch nicht werden. Ich schreibe dies, um zu betonen, dass niemand davon ausgehen sollte, dass er eine signifikante Verbesserung der Empfangsqualität durch einen trivialen oder laienhaften Austausch des LNB
erreichen kann, also ohne Aufwand, zufällig oder wie man sagt, "das blinde Huhn findet auch ein Korn."

-A- -B-
-C-
-C-
►►Eutelsat 21B at 21.5°E-Western-11 603,790 MHz-LUXE Radio : Statistics of PIDs in the TS and HTTP Stream reader
11 603.790 MHz : LUXE Radio
Statistics of PIDs in the Transport stream and Stream reader
Statistik der PID im Transportstrom und Stream-Leser
PIDs štatistika v transportom streame a čítačka dátového toku
Audio#1 : French (AAC/LATM),48.0 kHz,216 kbit/sec (PID:0x0065, PESID:0xc0)

►►Eutelsat 21B at 21.5°E-Western-11 603,800 MHz-LUXE Radio: Continuous signal monitoring / Nepretržitý signálny monitoring
>1,Monitored frequency f=11 603,800 MHz_H_SR=185 ksym/s_LUXE Radio<
Total unit of quantity of visualized evidence in signal monitoring : 136 hours
Gesamteinheit der Menge an visualisierten Beweisen beim Signalmonitoring : 136 Std.
Celková jednotka kvantity vizualizovaného dokazovania v signálnom monitoringu : 136 hodín
30-31.8.2024 31-1.9.2024 1-2.9.2024 2-5.9.2024
(370_10 GHz) (370_9.75 GHz) (450) (450)
——————— ——————— ——————— ——————
24h 24h 24h 64h
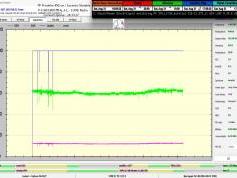
►EN_Classification of achieved results at f=11 603,800 MHz: PF 450 cm_Dosiahnuté priebehy vo vizualizovanej forme dokazovania týmo verifikujú exemplárny, alebo nasledovaniahodný výsledok dokazujúci stabilitu príjmu na 100% v celkovej jednotke dokazovania t=88 hodín,kedy ani na jednu sekundu nedošlo k rastu úrovne kanálovej chybovosti Pre-Viterbi BER na vyššiu hladinu ako 1E-5,napríklad 1E-4 alebo 1E-3 , čo dokazuje modrý priebeh kvality "Q",ktorý zotrváva konštatne na úrovni 100% v celej jednotke monitorovania 24+64 hodín.
►DE_Klassifikation der erreichten Ergebnisse bei f=11 603,800 MHz: PF 450 cm_The achieved waveforms in the visualized form of verification confirm an exemplary or follow-worthy result, demonstrating 100% stability of reception in the total verification unit over t=88 hours, during which not even for one second did the Pre-Viterbi BER channel error rate rise to a level higher than 1E-5, such as 1E-4 or 1E-3. This is evidenced by the blue quality curve "Q," which remains constant at 100% throughout the entire monitoring unit of 24+64 hours.
►Klasifikácia dosiahnutých výsledkov na f=11 603,800 MHz: PF 450 cm_Die erreichten Verläufe in der visualisierten Form der Verifizierung bestätigen ein exemplarisches oder nachahmenswertes Ergebnis, das eine 100%ige Stabilität des Empfangs in der gesamten Verifizierungseinheit über t=88 Stunden nachweist, während der die Pre-Viterbi BER-Kanalfehlerquote nicht einmal für eine Sekunde auf ein höheres Niveau als 1E-5, wie z. B. 1E-4 oder 1E-3, anstieg. Dies wird durch den blauen Qualitätsverlauf "Q" belegt, der während der gesamten Überwachungseinheit von 24+64 Stunden konstant auf 100% bleibt.
PROVING > Eutelsat 21B at 21.5°E - Western beam
Nepretržitý monitoring signálnych parametrov v dĺžke 1x64 hodín
Continuous monitoring of signal parameters for a period of 1x64 hours
►Deň záznamu monitoringu : od 2.9.2024 do 5.9.2024
►Intelsat 901 na 27,5°W : Vyžarovací diagram "Western"
zemepisný bod výskumov a meraní : 48°33 N _ 19° 67 W : Lučenec-Slovenská republika
vyžarovací diagram pochádza zo zdroja : eutelsat.com
►Wetterverhältnisse / Weather conditions / Poveternostné podmienky : Priebehy meteogramov zo zdroja shmu.sk potvrdzujú
že počas celého priebehu monitoringu sa nevyskytli žiadne prehánky a prevládala jasná a bezoblačná obloha,čiže príjem nebol nijakým
spôsobom negatívne ovplyvnený počasím.
►Methodological procedure of measurements / Methodisches Verfahren für Messungen / Metodický postup meraní
Vedecko-výskumné centrum autora Romana Dávida z Lučenca zamerané na zóny satelitného príjmu "Mimo stopy" na adrese www.dxsatcs.com je tým dokázateľne prvým na svete,ktoré od roku 2020 začalo uplatňovať autorom zadefinovaný metodický postup meraní a zberu údajov z kontinuálneho signálneho monitoringu s dostatočnou dĺžkou,ktorého výsledky sa nedajú akýmkoľvek spôsobom spochybniť. Metodický postup stanovený autorom Romanom Dávidom týmto jednoznačne vylučuje akúkoľvek spojitosť dosiahnutých výsledkov s očakávaním na sporadicky prítomné špičky výkonu,alebo na dočasné deje v rôznych častiach atmosféry,ktoré krátkodobo umožnia uskutočniť nestabilnú formu družicového príjmu spadajúceho do kategorizácie náhody alebo "SAT DX". Zatiaľ čo všetky diskusné centrá po celom svete už viac ako 30 rokov postupujú podľa pseudovedeckej antimetodiky meraní,ktorej všetky výsledky sa dajú ako celok okamžite spochybniť a označiť ich ako irelevantné až zbytočné,vedecko-výskumné centrum Romana Dávida ako prvé a jediné na svete postupuje podľa metodického postupu meraní,ktorý generuje nespochybnitelné výsledky,ktoré môžu byť použité pre ďalšiu vedeckú a výskumnú činnosť v oblasti satelitného príjmu.Prezentácia sekundových lock-ov z frekvenčného spektra pri vysoko dynamických až permanentných zmenách v intenzitách výkonu v týchto zónach príjmu má samozrejme nulovú vedeckú hodnotu lebo už nasledujúcu sekundu,minútu,hodinu... po lock-u môže kvalita poklesnúť na nulu a publikovanie týchto pseudo-analýz je vo svojej podstate zbytočné a klamlivé.
EN_The scientific and research center of author Roman Dávid from Lučenec, focused on 'Out of footprint' satellite reception zones at www.dxsatcs.com is demonstrably the first of its kind in the world, whose results cannot be questioned in any way. This is because since the year 2020, it has been implementing a methodically defined procedure of measurements and data collection from continuous signal monitoring with sufficient duration,as defined by the author.The methodical procedure defined by author Roman Dávid clearly excludes any connection of achieved results with expectations of sporadically present performance peaks or temporary atmospheric phenomena,which momentarily enable an unstable form of satellite reception falling into the categorization of coincidence or 'SAT DX'.While all discussion centers worldwide have been following a pseudoscientific antimethodology of measurements for over 30 years,whose results can be immediately questioned and labeled as irrelevant or even pointless, Roman Dávid's scientific research center stands as the first and only in the world to proceed according to a methodical measurement procedure,which generates unquestionable results applicable to further scientific research in satellite reception.The presentation of second-locks from the frequency spectrum during highly dynamic and persistent changes in power intensity in these reception zones inherently possesses zero scientific value because the quality may drop to zero the following second,minute,hour... after the lock,rendering the entire presentation of this pseudo-analysis essentially pointless and deceptive.
DE :Das wissenschaftliche und Forschungszentrum des Autors Roman Dávid aus Lučenec, das sich auf 'Out of footprint' Satellitenempfangszonen auf www.dxsatcs.com konzentriert,ist nachweislich das erste seiner Art weltweit,dessen Ergebnisse in keiner Weise angezweifelt werden können. Dies liegt daran, dass es seit dem Jahr 2020 ein methodisch definiertes Verfahren zur Messung und Datensammlung aus kontinuierlicher Signalüberwachung mit ausreichender Dauer implementiert hat,wie vom Autor definiert.Das methodische Verfahren,das vom Autor Roman Dávid definiert wurde,schließt klar jede Verbindung der erzielten Ergebnisse mit Erwartungen an sporadisch auftretende Leistungsspitzen oder temporäre atmosphärische Phänomene aus,die vorübergehend eine instabile Form des Satellitenempfangs ermöglichen,die in die Kategorisierung von Zufall oder 'SAT DX' fällt.Während alle Diskussionszentren weltweit bereits seit über 30 Jahren einer pseudowissenschaftlichen Antimethodik der Messungen folgen,deren Ergebnisse sofort als Ganzes in Frage gestellt und als irrelevant oder sogar überflüssig bezeichnet werden können, handelt das wissenschaftliche Forschungszentrum von Roman Dávid als erstes und einziges auf der Welt nach einem methodischen Messverfahren, das unbestreitbare Ergebnisse liefert,die für weitere wissenschaftliche und Forschungstätigkeiten im Bereich des Satellitenempfangs verwendet werden können.Die Darstellung der Trägerverriegelung im Frequenzspektrum während dynamischer und dauerhafter Änderungen in der Leistungsintensität in diesen Empfangszonen hat selbstverständlich keinerlei wissenschaftlichen Wert,da die Qualität bereits die nächsten Sekunde,Minute,Stunde ... nach der Trägerverriegelung auf null sinken kann,was die gesamte Präsentation dieser Pseudoanalyse im Wesentlichen nutzlos und betrügerisch macht.
TBS 5927+EBSpro >>> SNR peak=15,5 dB
celkový čas signálneho monitoringu : 64 hodín
od 2.9.2024 do 5.9.2024
►KOMPLEXNÝ POHĽAD zahrňujúci kvalitu Q v jednotke-% , úroveň výkonu v jednotke dBm , kvalitu SNR v bezrozmernej jednotke dB , chybovosť BER ...

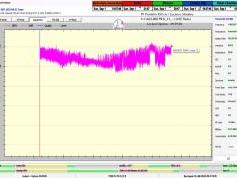
►DETAILNÝ POHĽAD zameraný na kvalitu príjmu a okamžité zmeny odvodené od jednotky merania SNR v trvaní 64 hodín

►Detailná analýza vývoja zmien kvality SNR s časovým kódom počas celého monitorovaného úseku 64 hodín v online video ukážke,
ktorá vylučuje pochybnosti všetkého druhu o reálnosti dosiahnutých úrovní kvality,poprípade akékoľvek dodatočné manipulácie
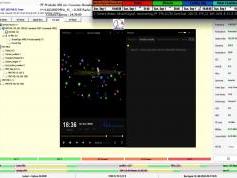
►+24 hodín _ Priebežný stav v signálnom monitoringu dňa 3.9.2024 a online video ukážky z vysielania Rádia LUXE_ TSA OK
-okamžitá kvalita osciluje okolo SNR=14,5 dB -
►+48 hodín_ Priebežný stav v signálnom monitoringu dňa 4.9.2024 a online video ukážka z vysielania Rádia LUXE_TSA OK
-okamžitá kvalita osciluje okolo SNR=14,5 dB -
►+ 64 hodín_priebežný stav v signálnom monitoringu dňa 5.9.2024 a online video ukážka z vysielania Rádia LUXE_TSA OK
-okamžitá kvalita osciluje okolo SNR=14,5 dB -
►►Eutelsat 21B at 21.5°E-LOW SR-satellite reception-copyright : Research project
![]() All the information, images, measurements and analyses in Ku band frequency spectrum in high frequency engeneering and wave physics are results
All the information, images, measurements and analyses in Ku band frequency spectrum in high frequency engeneering and wave physics are results
that come exclusively from scientific research conducted by Roman Dávid - the author and the owner of www.dxsatcs.com. All the information found on
www.dxsatcs.com are protected by copyright as a part of intangible property and are protected by EU law and Slovak national legislation. Usage, copying
and distribution of any information or its parts without author's permission is strictly prohibited.
![]() Všetky informácie,grafické zobrazenia,výsledky meraní a analýz príjmu vo frekvenčnom spektre pásme Ku pochádzajú výlučne z vedecko-výskumnej
Všetky informácie,grafické zobrazenia,výsledky meraní a analýz príjmu vo frekvenčnom spektre pásme Ku pochádzajú výlučne z vedecko-výskumnej
činnosti autora dxsatcs.com Roman Dávida z oblasti vlnovej fyziky a VF techniky a spadajú do jeho duševného vlastníctva,ktoré je chránené zákonmi
Európskej únie a Slovenskej republiky .Ich celkové alebo čiastočné kopírovanie, imitovanie alebo distribúcia bez súhlasu autora je výslovne zakázaná
z dôvodu výhradného vlastníctva autorom .
author : Roman Dávid_the founder of the Czech & Slovak DX Satellite Club_Think-Tank © Lučenec 2024 / Slovak republic


